
Understanding the Buying and Selling Pressure Behind Price Movement
If you’ve ever looked at a chart and wondered:
“Why did price move the way it did?”
you’re asking one of the most important questions a trader can ask.
A candlestick chart tells us where price traveled. It shows us the open, high, low, and close. It shows us the path the market took.
But it doesn’t always tell us what was happening behind the movement.
Two charts can look identical on the surface, yet the story underneath can be completely different.
This is where Cumulative Volume Delta, commonly called CVD, comes in.
CVD helps traders look beyond the candle and analyze the relationship between aggressive buying and aggressive selling pressure.
It doesn’t replace price.
It doesn’t predict the future.
Instead, it helps answer a different question:
“What is happening underneath the price movement?”
My First Impression of CVD
When I first came across CVD, I honestly wasn’t sure what to think.
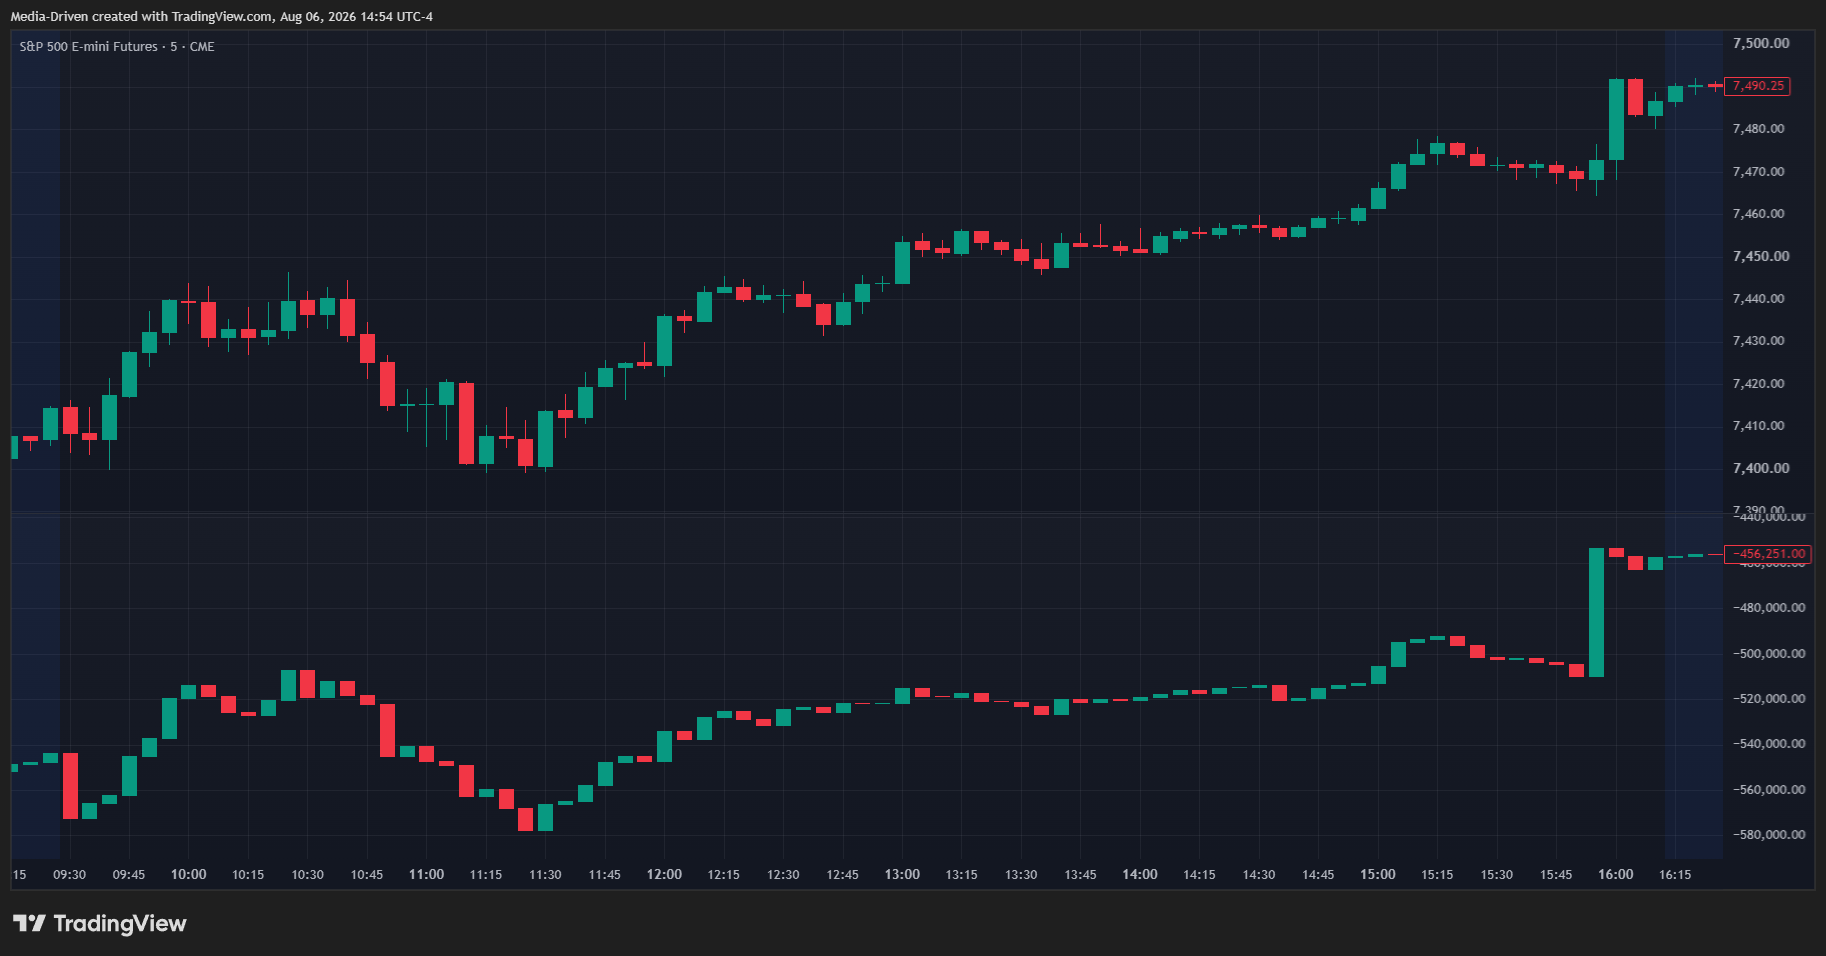
At first glance, it looked very similar to a price chart.
I remember thinking:
“Why would I use this? It looks like I’m just looking at another version of price.”
The value wasn’t obvious right away.
It wasn’t until I started comparing the relationship between price and CVD — looking at alignment, momentum, and divergence — that it started to make sense.
The important realization was:
CVD wasn’t trying to replace price. It was helping explain what was happening behind price.
And that difference changed the way I looked at charts.
Looking Under the Hood: Price vs CVD
Think about a vehicle driving down the road.
The vehicle itself represents price.
It tells you where the market has gone.
The engine represents CVD.
It gives you insight into what is helping power the movement.
Two vehicles can both travel at the same speed, but their engines may tell completely different stories.
One vehicle may have:
- strong acceleration,
- plenty of power,
- a healthy engine.
Another may be:
- coasting,
- losing power,
- relying on momentum.
From the outside, both vehicles are moving.
But looking under the hood tells you something different.
Price shows the destination.
CVD helps show what is powering the trip.
Understanding the Bid and Ask
Before we can understand delta, we first need to understand the bid and ask.
The bid is the highest price a buyer is currently willing to pay.
The ask (or offer) is the lowest price a seller is currently willing to accept.
Think of it like negotiating over a car.
A buyer may say:
“I’ll pay $30,000.”
That is the bid.
A seller may say:
“I’ll sell it for $31,000.”
That is the ask.
For a trade to happen, one side has to become more aggressive.
A buyer who wants to enter immediately does not wait for a lower price. They pay the seller’s asking price.
They lift the ask.
A seller who wants to exit immediately does not wait for a higher price. They accept the buyer’s current offer.
They hit the bid.
This difference between passive orders waiting and aggressive orders executing is what creates delta.What Is Cumulative Volume Delta?
To understand CVD, we first need to understand delta.
Every trade has two sides:
- A buyer
- A seller
But not all buying and selling happens the same way.
Some traders are more aggressive.
Aggressive buyers
These traders are willing to pay the current asking price to enter a position.
They are actively lifting the ask.
Aggressive sellers
These traders are willing to sell into the current bid.
They are actively hitting the bid.
Delta measures the difference between these aggressive buyers and sellers.
A simplified example:
More aggressive buyers than sellers:
Positive Delta
More aggressive sellers than buyers:
Negative Delta
Cumulative Volume Delta adds these differences together over time to show the ongoing pressure between buyers and sellers.
What Does CVD Actually Tell Us?
The biggest mistake with CVD is thinking:
“CVD tells me exactly where price is going.”
It doesn’t.
Instead, think of CVD as information about participation.
It helps answer questions like:
- Are buyers supporting this move higher?
- Are sellers becoming more aggressive?
- Is price moving with participation behind it?
- Is something changing beneath the surface?
When Price and CVD Agree
One of the easiest ways to understand CVD is by looking at alignment.
Imagine a vehicle accelerating down the highway.
The vehicle is moving faster.
The engine RPM is increasing.
Everything matches.
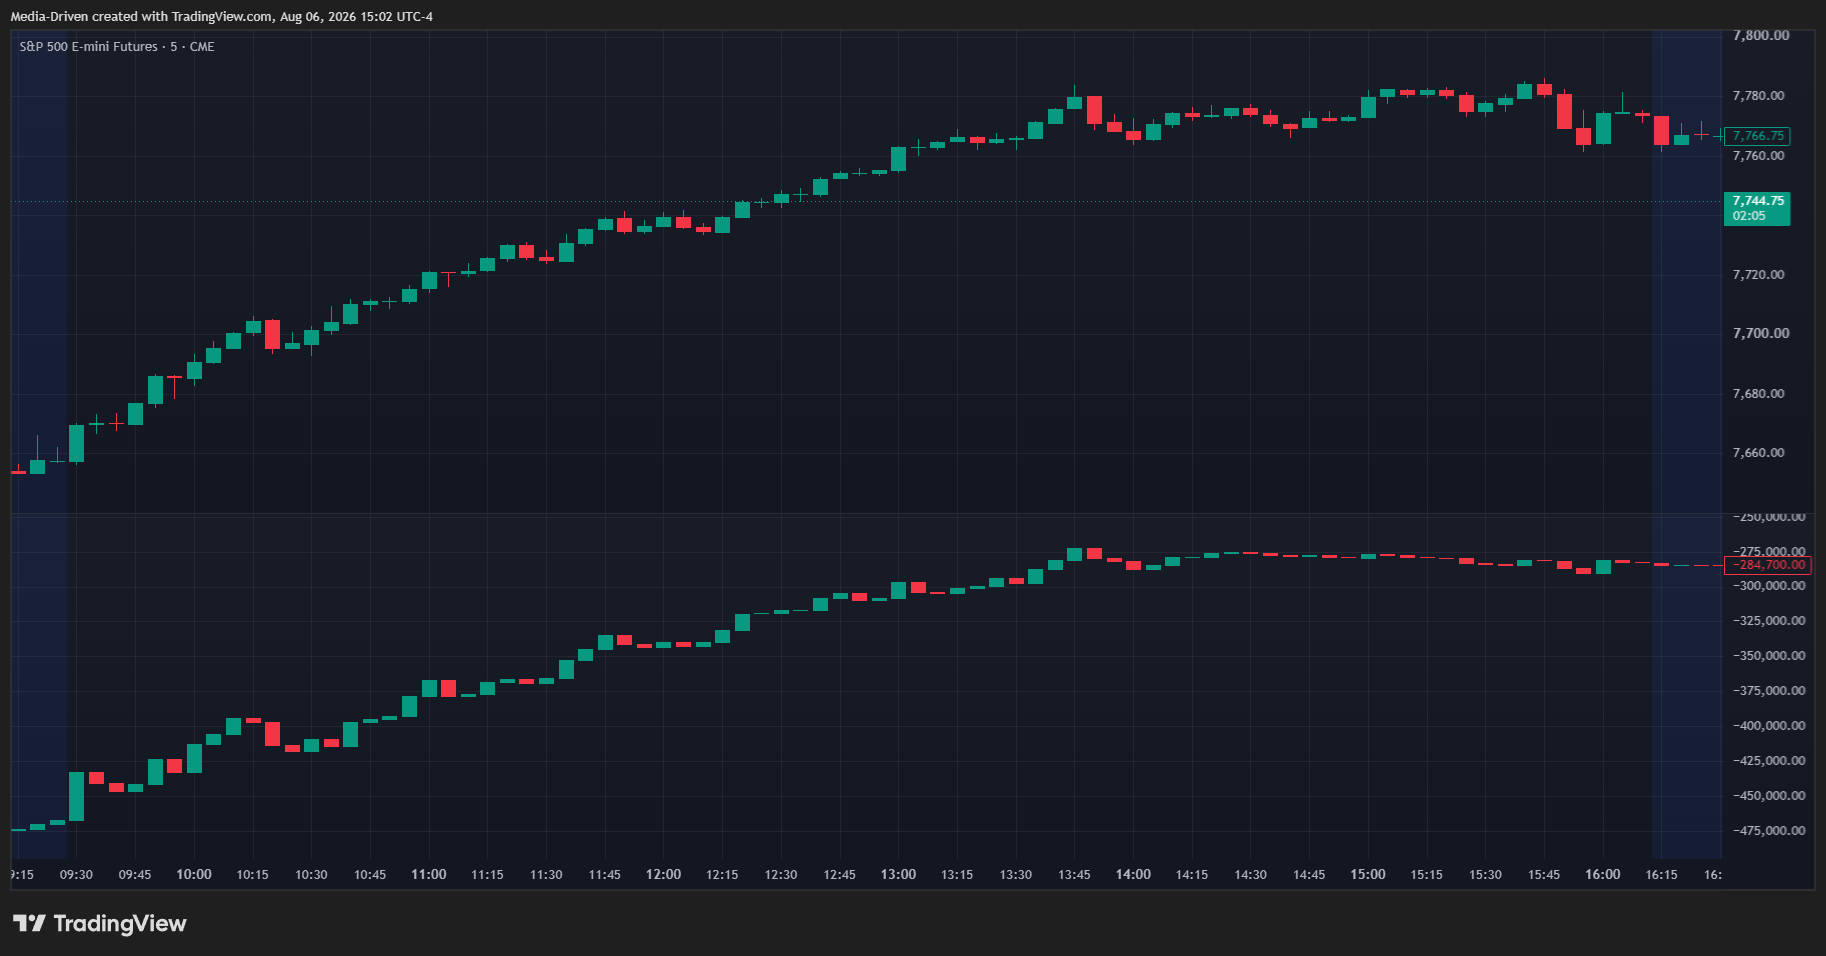
In trading:
- Price is moving higher.
- CVD is also moving higher.
This suggests aggressive buying pressure is supporting the move.
The same idea applies in the opposite direction:
- Price moving lower.
- CVD moving lower.
Selling pressure is supporting the decline.
This does not guarantee continuation, but it tells us the movement has participation behind it.
When Price and CVD Disagree
Now imagine the vehicle is still moving forward, but the engine is no longer producing the same power.
The vehicle has momentum.
But something underneath has changed.
This is where divergence comes in.
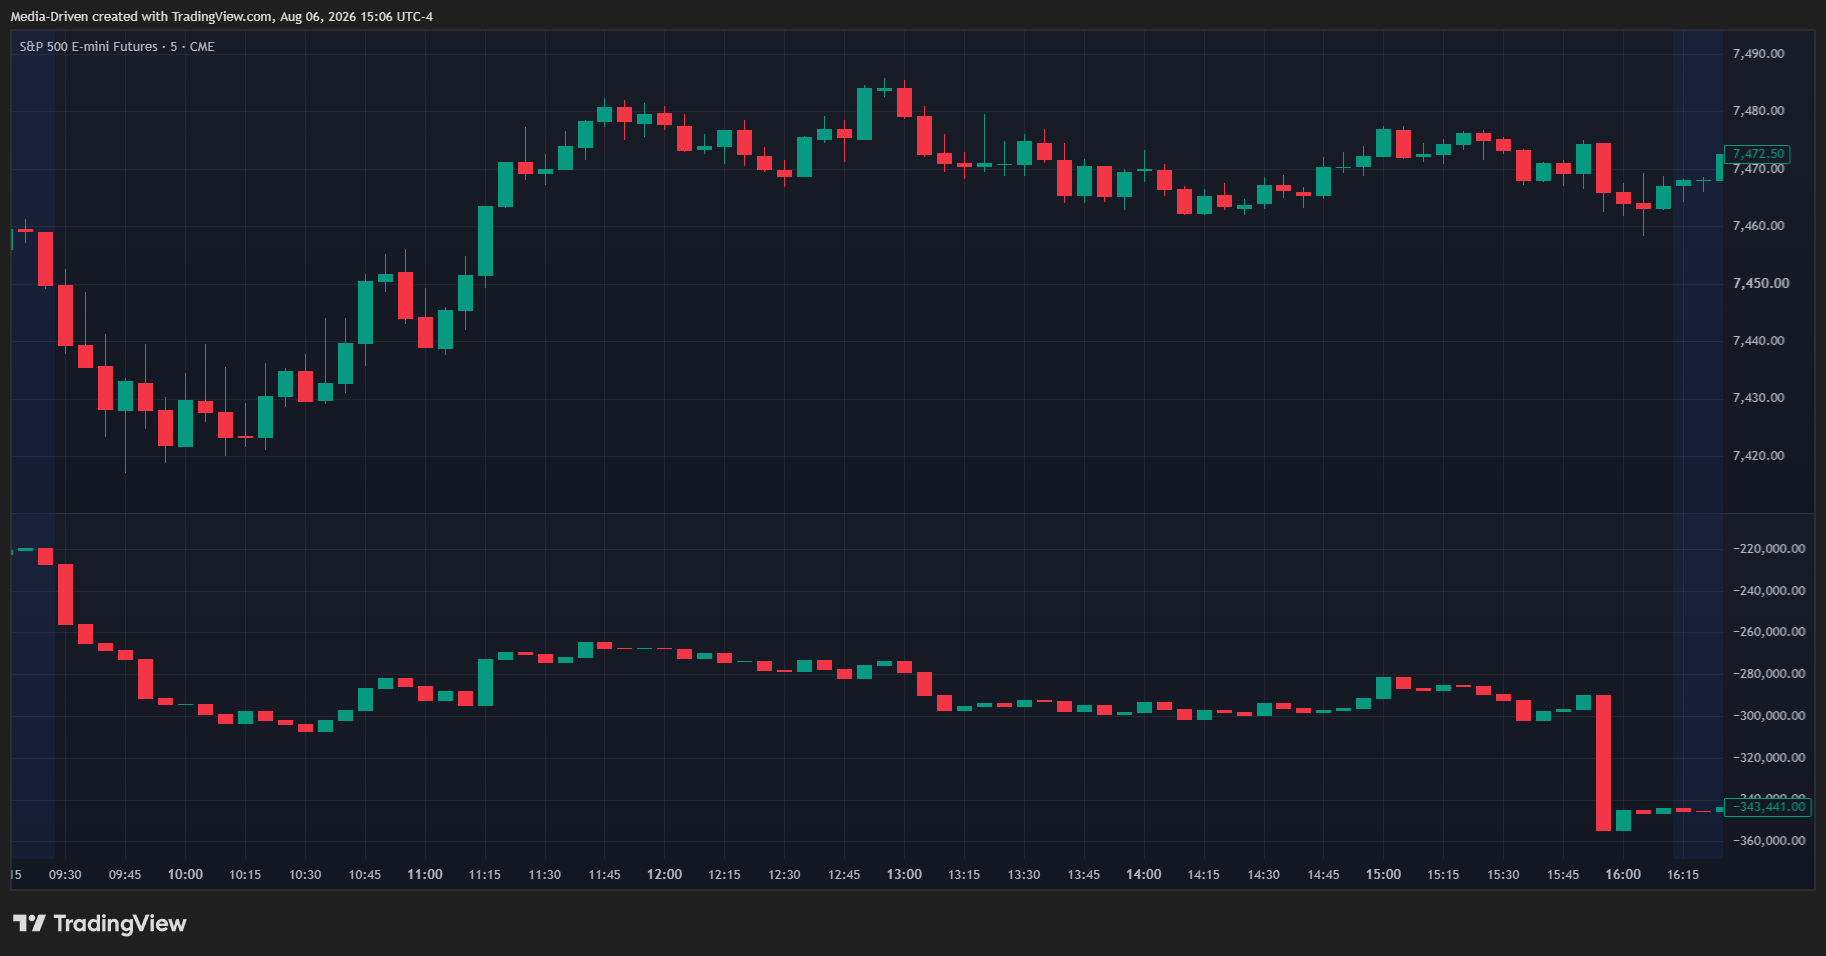
A common example:
- Price makes a new high.
- CVD makes a lower high.
Something has changed.
But what?
This is where traders need to slow down.
The mistake is assuming:
“Divergence means the market must reverse.”
That is not always true.
Divergence is a clue.
It is a reason to investigate.
Divergence: Warning Light, Not a Stop Sign
Think about your vehicle’s dashboard.
If a warning light appears, what does it mean?
It does not necessarily mean:
“The vehicle is immediately broken.”
It means:
“Something changed. Take a closer look.”
CVD divergence works the same way.
A divergence may suggest:
- momentum is changing,
- participation is weakening,
- buyers or sellers are becoming less aggressive.
But the market still needs context.
Ask:
- Where is this happening?
- Is price at an important level?
- Is the trend still intact?
- Is another force absorbing the pressure?
Divergence and Location: Where Is the Warning Light Appearing?
A divergence becomes more meaningful when it occurs in an area where the market has a reason to react.
Think about a vehicle dashboard warning light.
A warning light appearing while cruising on a flat road might deserve attention, but it may not require immediate action.
A warning light appearing while climbing a steep hill under heavy load is a different situation.
The same idea applies to CVD divergence.
A divergence occurring randomly in the middle of a trend may simply be a temporary change in participation.
But a divergence occurring near an important price area may deserve more attention.
Examples of important areas could include:
- Previous highs or lows
- Support and resistance zones
- VWAP
- Prior session levels
- Areas where price has previously reacted
For example:
Price pushes into a previous high.
CVD begins weakening.
This does not automatically mean price will reverse.
However, the combination tells us:
“The market is testing an important area, and the participation behind the move is changing.”
That is a much more valuable observation than simply saying:
“CVD diverged, so I should trade against the move.”
The Hidden Story: Absorption
One of the most interesting situations with CVD is when price and CVD disagree because of absorption.
For example:
- Price continues moving higher.
- CVD moves lower.
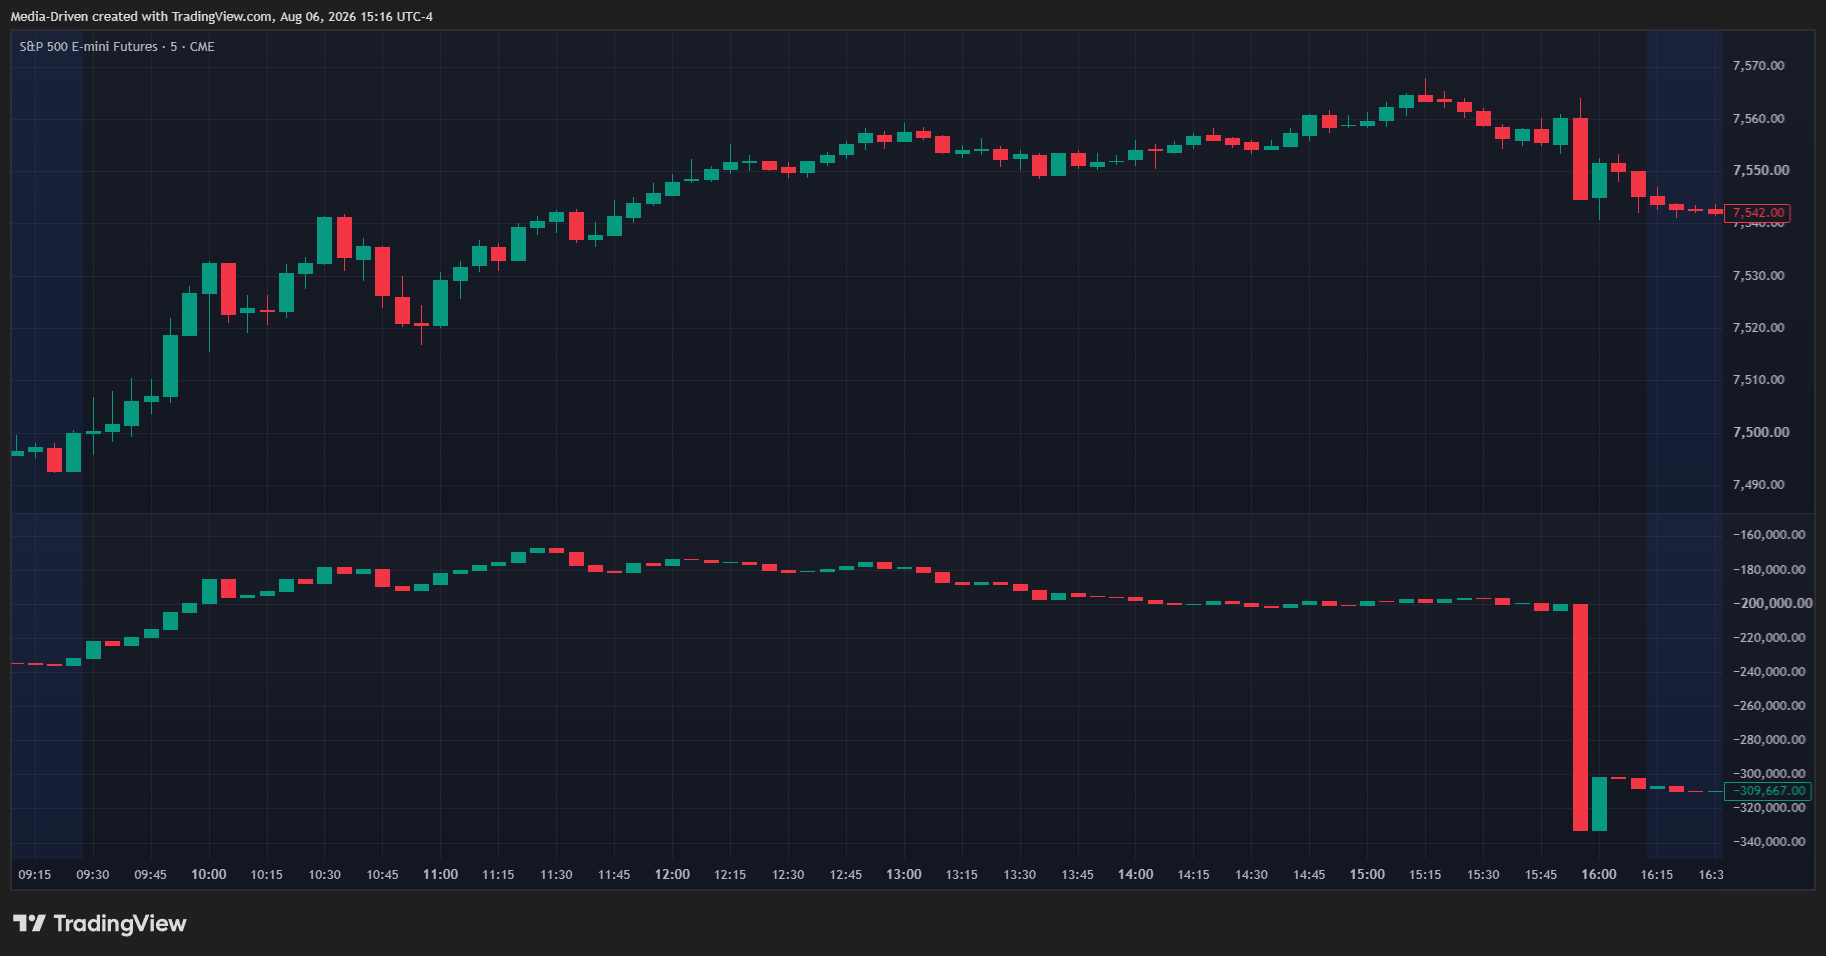
At first glance, this may appear bearish.
If aggressive sellers are dominating, why is price not falling?
The answer can be absorption.
Remember, CVD mainly shows aggressive buying and selling activity. It does not show every resting limit order waiting in the market.
A large buyer may place limit buy orders below the current price and patiently absorb aggressive sellers as they sell into those orders.
The sellers are aggressive.
They are hitting the bid.
CVD reflects that selling pressure.
But the buyers are willing to absorb those sells without allowing price to move lower.
The result?
Selling pressure appears strong, but price holds or even moves higher.
Think about a vehicle trying to slow down while still moving forward.
The brakes are being applied, but the engine still has enough power to continue.
The warning light is not telling us:
“The vehicle is definitely stopping.”
It is telling us:
“Something unusual is happening. Investigate.”
The same concept works in reverse. Aggressive buyers can be absorbed by limit sellers, preventing price from continuing higher.
Using CVD With EMA Alignment
One thing that helped make CVD easier to interpret was adding moving averages to the indicator.
Raw CVD movement can sometimes be difficult to read because it can be noisy.
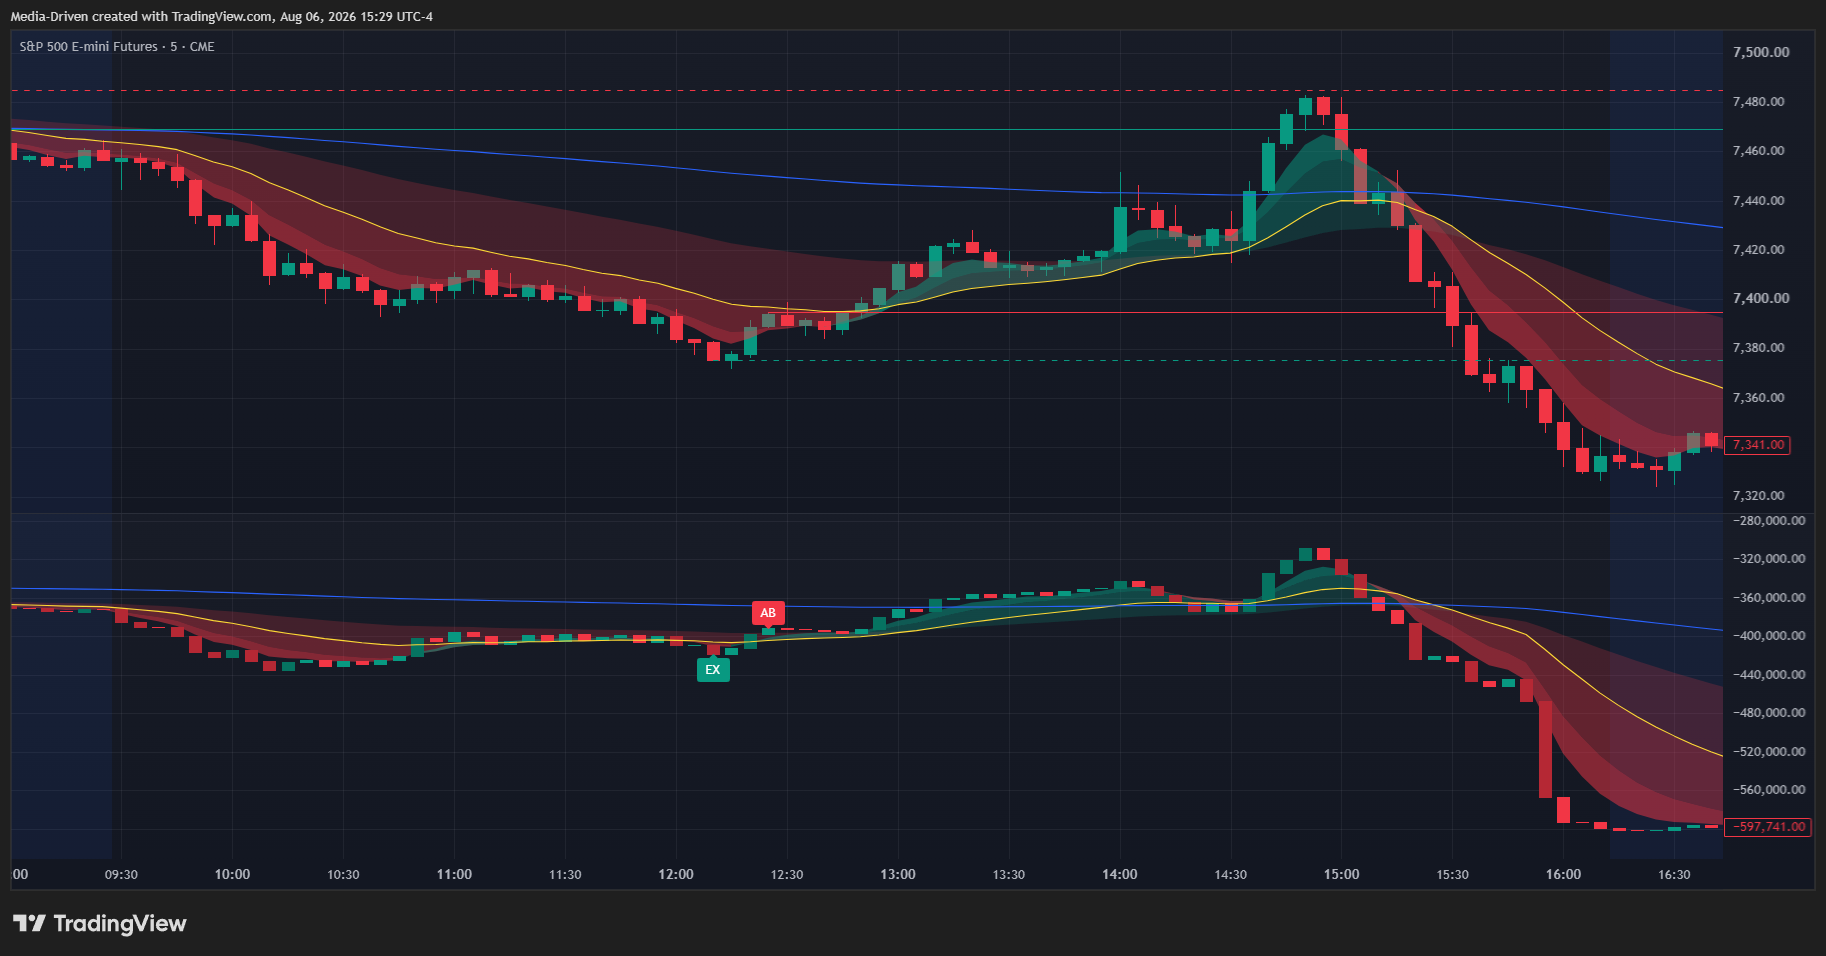
EMA alignment helps visually show the bigger picture:
- Is CVD momentum improving?
- Is it weakening?
- Are different timeframes agreeing?
Much like looking at multiple gauges on a dashboard, the goal is not to rely on one measurement.
It is to understand the overall condition.
Common Mistakes When Using CVD
Mistake #1: Treating Every Divergence as a Reversal
Divergence is information.
It is not an automatic trade signal.
Mistake #2: Ignoring Price Structure
CVD does not replace support, resistance, trends, or market structure.
A divergence in the middle of nowhere is different from a divergence at an important area.
Mistake #3: Looking at CVD Without Context
The best information comes from combining multiple pieces:
- Price
- Volume
- Market structure
- VWAP
- Momentum
- Higher timeframe context
Think Like a Trader
Instead of asking:
“Should I buy or sell because CVD changed?”
Try asking:
“What is the relationship between price and participation telling me?”
Before making a decision, consider:
- Is price confirming CVD?
- Is CVD confirming price?
- Has something changed beneath the surface?
- Is this a warning sign or simply normal market behavior?
- What other evidence supports this idea?
The goal is not to find one magical answer.
The goal is to build a better understanding of the market.
Final Thoughts: Learning to See Beyond the Candle
CVD is not valuable because it gives traders another indicator to watch.
It is valuable because it helps answer a deeper question:
“What is happening underneath the move I am seeing?”
A candle shows the result.
CVD helps provide additional insight into the activity behind that result.
Like looking under the hood of a vehicle, it gives you more information about what is actually happening before you decide where you want to go next.
The goal is not to blindly follow an indicator.
The goal is to understand the information it provides and use that knowledge to make your own decisions.
The goal of education is not to fill a bucket. It’s to light a fire.
Continue Learning
Coming soon:
- What Is Volume Delta?
- Understanding Absorption in Trading
- CVD Divergence: Reversal or Continuation?
- How Footprint Charts Work
- Combining CVD With VWAP and Market Structure
Media-Driven JJ CVD Indicator
The JJ CVD indicator was created to help traders visualize these concepts directly on TradingView by combining cumulative volume delta data with tools designed to make momentum, alignment, and divergence easier to observe.
It is designed as a learning tool to help traders better understand order flow concepts and develop their own process.